

If you want to create a meaningful project status report, here is what you will need: lots of time, clear communication and data from multiple sources. This presents a challenge for many project managers busy with their day-to-day operations. Still, if you are trying to stay in control of the project progression, you will need answers to the essential questions. And on a regular basis, too.
This article will teach you what to watch out for regarding the project status report contents. You will learn about the essential elements and will find proven templates as well as a project status report example which you can recreate.
These are the chapters in store for you:
- Definition project status report
- When to create a project status report
- Project status report contents – what goes in?
- Project status report example
- Role of the project management office (PMO)
- Conclusion – Project Status Report
A strong recommendation up front: by all means get advice on the project status report topic from the PMO. This way, these reports are more likely to be given priority and will not fall by the wayside due to time constraints.
Now, let us get started.
Definition Project Status Report
The report on the status of the project helps control a project. At specified and regularly recurring dates, the status of the project is documented using key indicators. In most cases, this is a combination of content-related information and organizational and commercial key figures. The contents of the report can vary considerably depending on the type of project and the industry.
When to Create a Project Status Report
As a rule, you will create a project status report on a regular basis. In it, you define the current status of your project and inform the decision-making body and other stakeholders about it. You can create the report daily, weekly or monthly during the entire lifecycle of your project. The purpose of the project status report is to ensure the goals and results of the project are achieved.
Project Status Report Contents – What Goes In?
In contrast to mere descriptions by project managers towards their superiors, project status reports allow more detailed information on the progress of projects. This applies even more when there are many projects. Here, it becomes difficult to invite all project managers at the same time to report. In such a case, standardized reports are helpful.
So, what do you need to include in the project status report? The contents of this target-oriented and easy-to-read report have to give answers to the right questions. These questions could regard the following issues:
- Overall state of the project
- Status of the work performed
- Adherence to the effort, cost and time plan
- Risk assessment
It is important to note that you may use different types of project status report templates. The type depends on the project size – whether large or small. In the end, your effort for creating a status report should remain affordable and in proportion. Whether you are dealing with a huge construction project or a small IT project.

Always see to it that the form of the reports for the different project types stays the same throughout. This makes them better to historize and compare. What is more, you will find it easier to orient yourself knowing where to find what information.
Tip: Create individual templates for your status reports depending on the project type (e.g. large / small). This facilitates the orientation and the historization for the subsequent alignment of the reports.
If you have many parallel projects, you may not even be able to look at all projects in every reporting meeting. In such a case, you need a project list allowing the correct selection of projects to look at.
Special Download: Advantages of MS Project Server / Project Online over MS Project Standard
Please click here to download the PDF and learn why you should prefer the server over the client version.
For this purpose, you maintain one row per project with the most important information and indicators. It should be possible to filter and sort the project list. This will allow you to identify the ten most important projects from possibly more than one hundred for your steering committee meeting.
Tip: Too many projects at once? Create a project list with the most important information and select the ten most important projects – depending on the traffic lights, all red ones, a few yellow and the odd green one here and there to check (see below).
In your regular steering committee meeting – we recommend a duration of around two hours– you will look at only those ten project status reports.
Overall State of Your Project – Traffic Light Presentation
When reading a project status report, you are looking to get a general overview first. In case anything is wrong, you will want to look at the details in a second step.
Project Status Report: Traffic Light for the Overall State
The overall state is usually displayed as a single project status report traffic light with the colors red / yellow / green. This has two advantages:
- A clear statement
- The option to filter the list of projects according to traffic light colors
This overall traffic light should be set manually, in our experience. But it should follow a simple, plausible rule.
Tip: Look at the overall traffic light’s history. It will provide valuable information, especially the color changes between the reports – for the better as for the worse.
Optional Traffic Lights for Details
In addition to the overall traffic light, you can have further project status report traffic lights. These are calculated automatically from the target-actual comparison of work, cost and schedule.
In such a case, it might not be possible to set the overall traffic light to green while:
- at least one of the other traffic lights is red OR
- not all other traffic lights are green
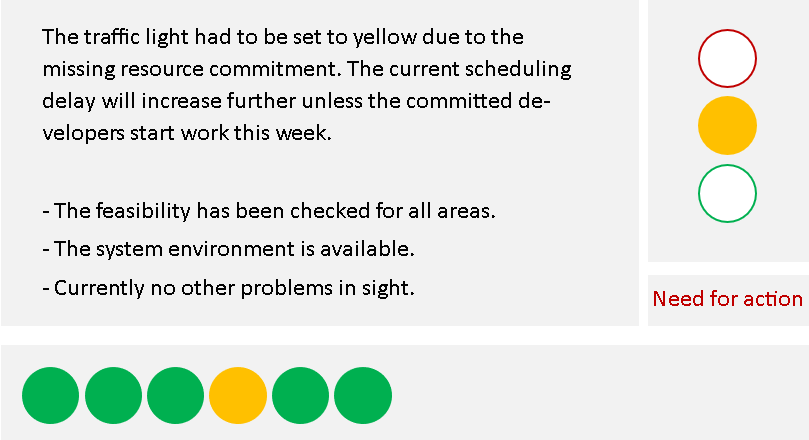
Important Indicator “Need for Action”
We recommend maintaining an indicator “need for action”. This project status category enables project managers, irrespective of the traffic light color, to ask for the resolution of unmade decisions or the detailed assessment of their project. Thus, they can make themselves heard before it is too late and the traffic light turns red.

The project manager should have the option to explain the traffic light or the current main issues. It should be possible to enter a short comment. But by all means short and to the point. It is best to limit the length to a few lines.
Tip: Especially in a multi-project environment, the project manager’s comments should be kept extremely short.
In a multi-project environment, a one-line comment can make sense, as this could be read directly in the project list. Displaying only the first line of a multiline description field tends to be of little help.
Interested in other useful reports? Read about the 5 Most Important PPM Reports.
Along with the status of the project, document the status of physical target achievement in your project status report by all means.
Contents: Stage of Project Completion (as a Rough Rule of Thumb)
Regarding the status of physical target achievement, you very often find percentage values delineating the stage of completion. But in the overall view of a project this project status category can never be more than a rough pointer.
While the value is calculated from the completion of the single tasks, the informative value of e.g. 71% is not exactly high. However, a plausibility check is possible. Simply compare the percentage value of the stage of physical completion with the target and actual values of work, cost and time.
Deliverables, Stage Gates and Milestones
It is better for the project manager to indicate the status of work performed by means of concrete information on the completion of deliverables.
This means listing deliverables that are:
- completed
- in progress
- to be handled next
Another option is to simply list all deliverables with their status as not started / in progress / completed.
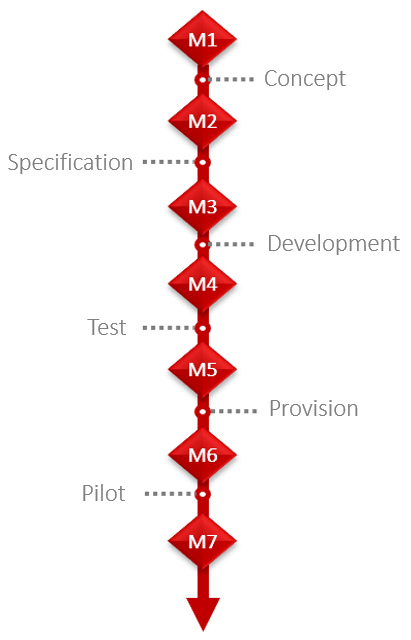
But there is an even easier way that is also independent of the project scope. It works well to describe the status through standardized milestones or stage gates. This has the advantage that all stakeholders will be able to tell from a single entry where the project stands.
Tip: Percentage values delineating the stage of project completion are only conducive to the overall view. The stage of completion of deliverables, stage gates, or milestones will provide more detail.
Having reached the milestone M3 could mean that the specification has been produced and approved. M7 could be the start of the production.
These delivery stages have to be defined individually for every type of project. Meanwhile, they can be found in all industries.
Tip: Celebrate particularly relevant delivery stages in public, too. This will boost the motivation of all participants in the project.
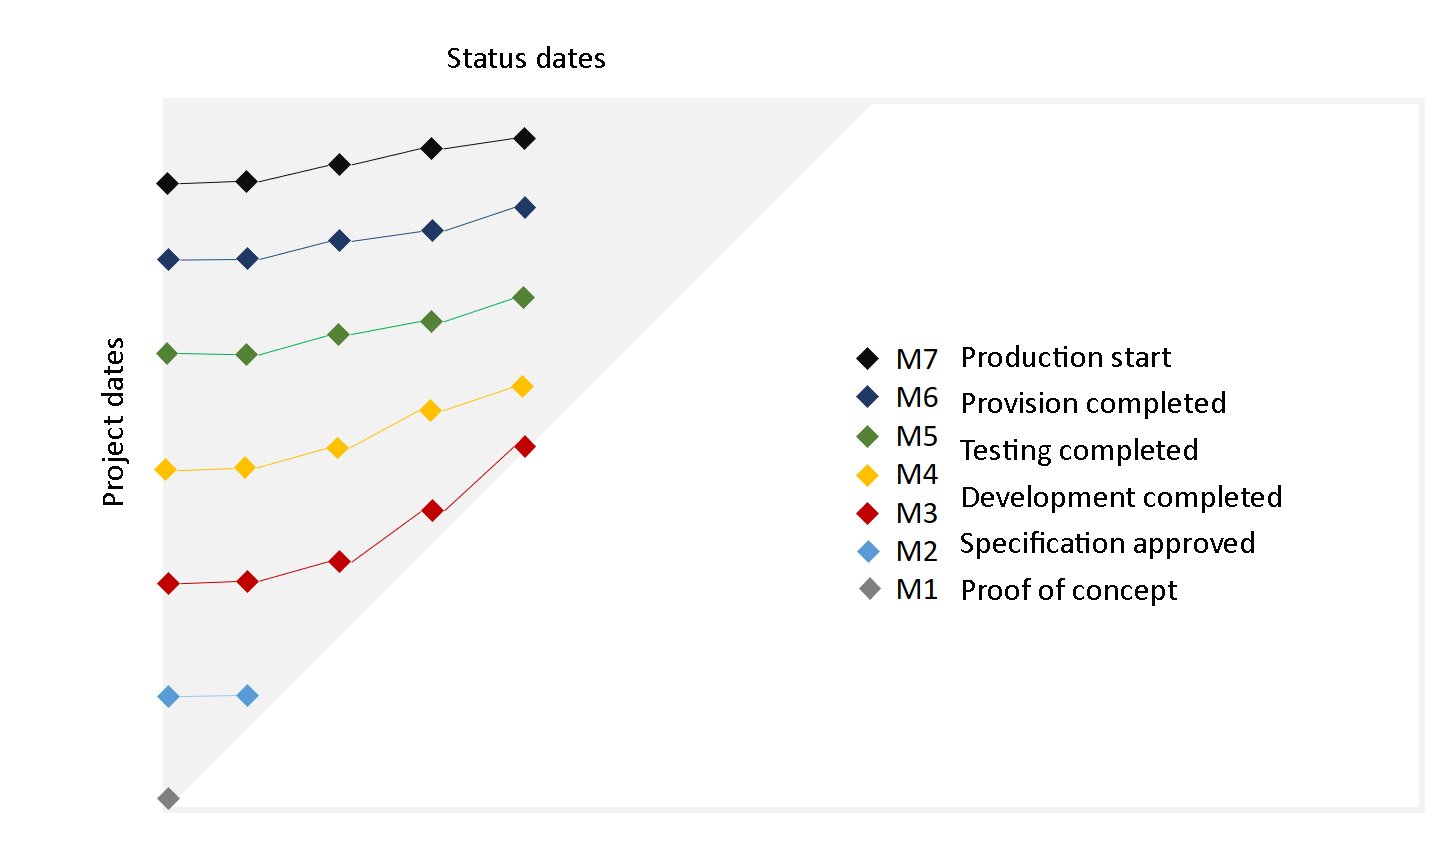
Contents: Milestone Trend Analysis (MTA)
Reporting milestones and their dates and variances in lists is not very clear or informative. Ideally, you historize the milestone dates on every status date. This enables you to create a milestone chart: the Milestone Trend Analysis (MTA).
TPG Service: Free MTA tool available for download here!
- Horizontally running lines between the milestone demonstrate the adherence to delivery dates
- Rising lines indicate delays
- Falling lines show a delivery ahead of schedule
Once you have become accustomed to the chart, you will see the project’s entire schedule development at a glance. You will be able to derive the future trend from this on your own.
Some representations also include the deadlines of the milestones. This means not only delays but also overruns become visible.
For more detail on how to use Milestone Trend Analysis, check this article.
Contents: Target-Actual Comparison of Work and Cost
In the most straightforward case, your project status report will compare the target values with the actual values. You can use figures for this or a bar chart. Do not forget to list the values of the current planning (i.e. the calculated costs and finish date), too. This will reveal variances from the target (baseline) before the end of the project.
If you have purchased deliveries or goods and services, it makes sense to include further values, such as:
- Commissions
- Bills
- Payment transactions
This makes for a striking increase in cost transparency. As a matter of fact, very often, a lot of time passes between commission and payment.
You should also distinguish between:
- Tied and free budget: this is the essential basis for possible changes in the project progression.
- Internal and external work and costs: you could structure work according to type (of service), cost according to cost type.
Thus, you will achieve a detailed comparability of similar projects. In particular, when you are trying to assess why the circumstances in this project differ from others of the same category.
Tip: For the target-actual comparison, it is worthwhile to look closely: is the budget tied or free? Are work and cost internal or external items?
These distinctions will help you. They will allow you to recognize problems in the making and to derive countermeasures. Counteracting such problems will be hard if all you have are aggregate amounts of work and cost across the entire project.
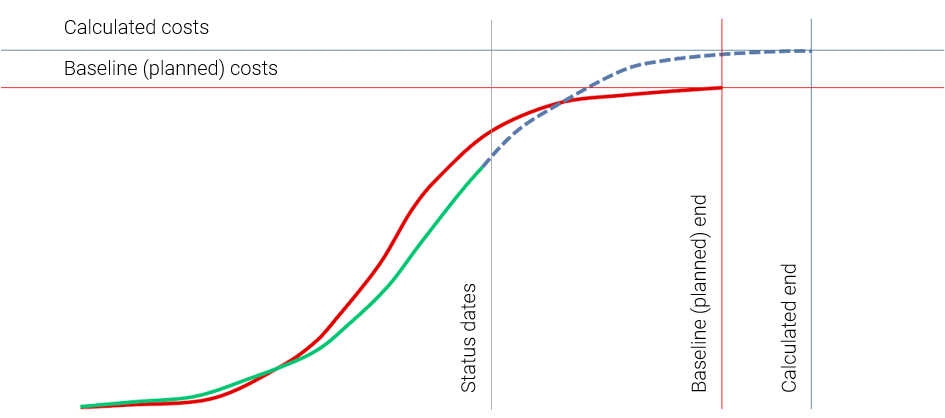
Tip: Use line charts similar to the milestones’ for this. They are more informative than mere numbers. You obtain them from the historization on the reporting dates.
To this end, present:
- The baseline curve from baseline start to baseline finish date
- The actual curve from actual start to the status date
To the right of the status date, continue the actual curve with the current target curve up to the current calculated finish date.
Contents: Risk Matrix
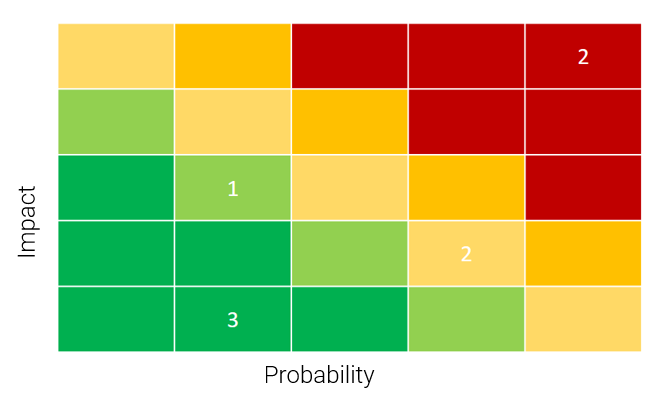
In principle, listing risks in a status report makes sense. If the list is not too long. But it is better to present a risk matrix that will always take up the same amount of space – irrespective of the number of risks. Again, this makes for better comparability.
Tip: Use the risk matrix to check your projects for risks. It will allow you to identify at a glance where there is need for action.
The risk matrix presents risks in a colored grid. In each cell, you enter the number of risks behind it. The focus is on the probability of occurrence and the impact of the risk.
The impact of a risk is the possible financial amount of loss. In practice, it is often very hard to determine. The easier route is to state the impact in points from 1 to 10 or in categories, such as low / medium / high.
The same goes for a risk’s probability of occurrence. A statement such as 63% suggests an accuracy unlikely to be correct. The division into 10 steps or the categories low / medium / high gives a better picture.
Tip: To estimate the probability of occurrence and the impact, it is better to work with steps and categories. In this case, figures tend to suggest an accuracy that is not actually warranted.
The Exception: If you want to present an overall risk for the project, you will always have to provide numbers. To this end, the impact is multiplied by the probability of occurrence of the risk in percent and added up.
The overall risk can be an important indicator for the closer consideration of a project.
Want to learn about risk management in project management? Read our article.
Contents: Need for Decisions in the Project Status Report
This project status category is about organizational and content-related issues that have been decided or are yet to be decided. Examples of this are:
- Commitment of resources
- Approval of orders
- Decision on a content-related variant
The indicator for “need for action” mentioned above plays a central role for this. With it, you will be notified that outstanding decisions need to be made by a competent body – even when the traffic light is green.
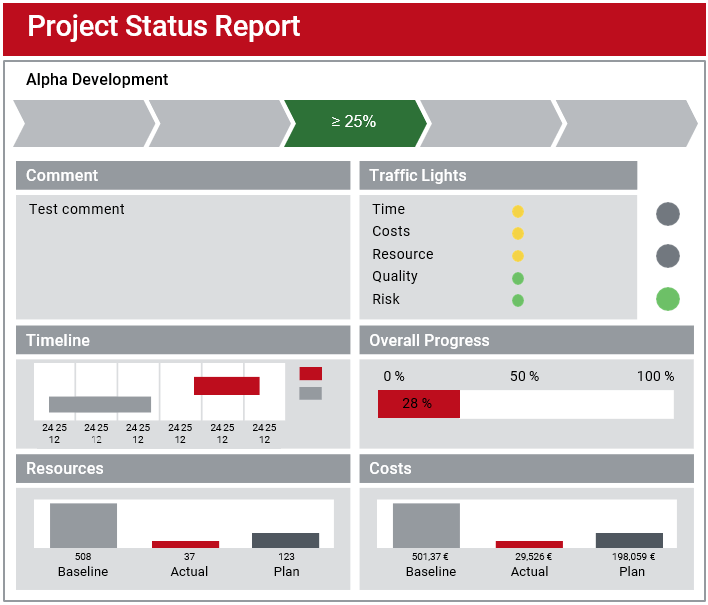
Project Status Report Example
The following project status report example features all important items of information. These are:
- How far along are we? (= position in the timeline)
- What is the overall status of the project? (traffic lights / overall traffic light manual)
- Comment by the project manager
- Comparison of the actual situation with the baseline
- Actual cost vs baseline
- Actual work vs baseline
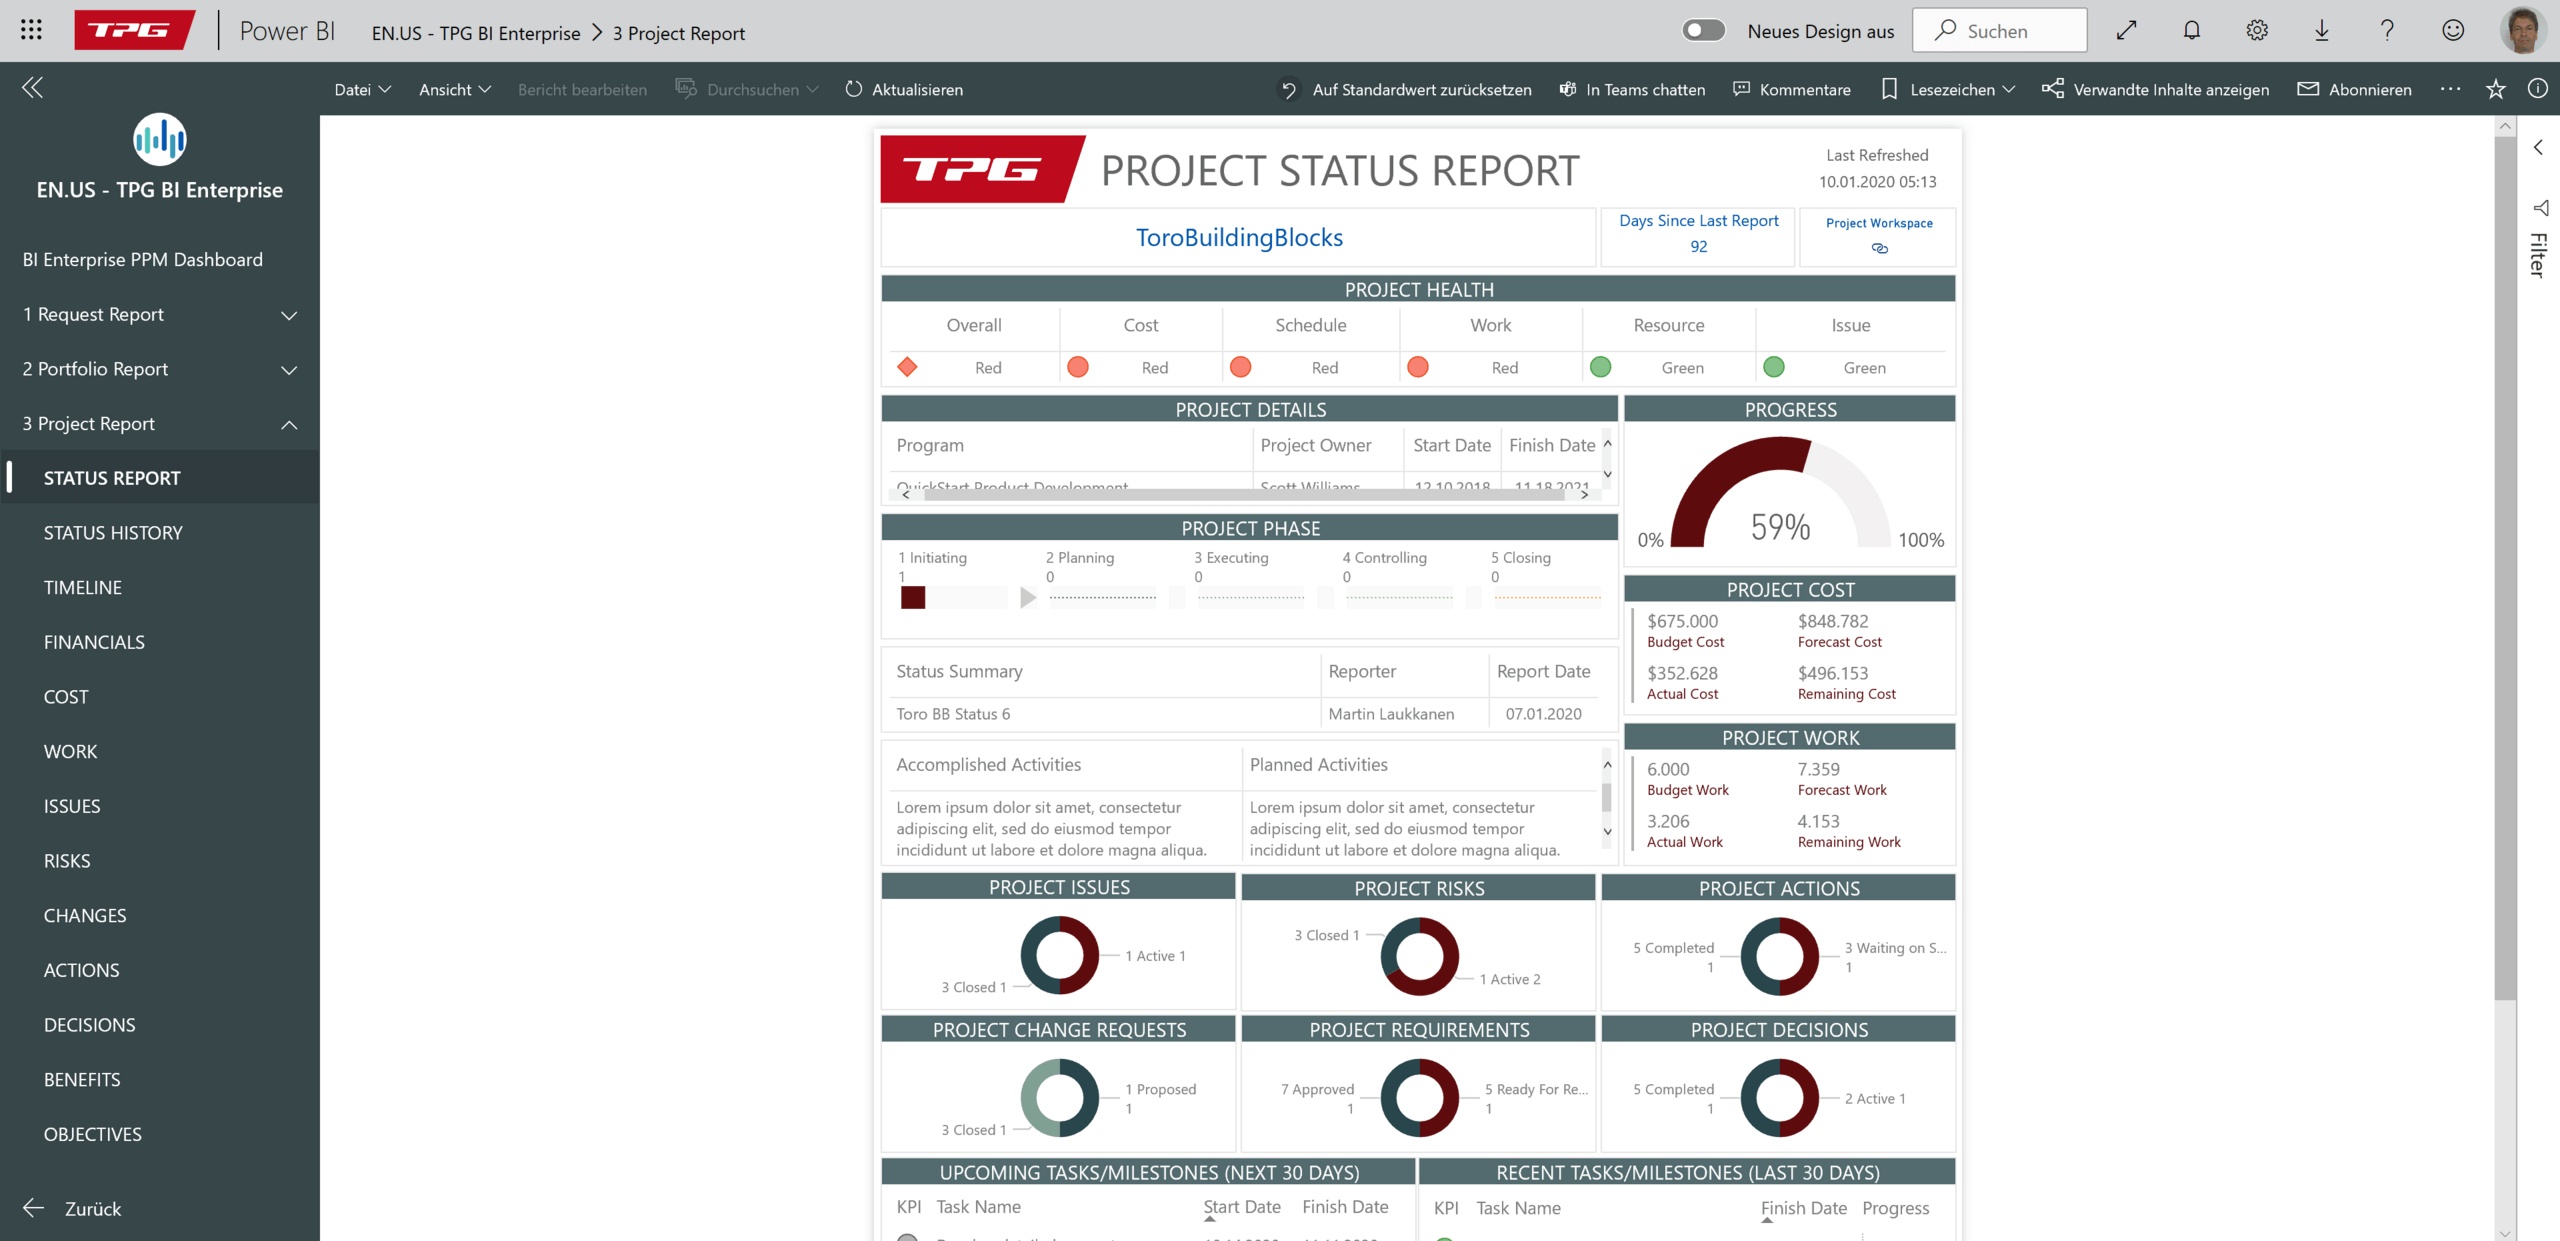
The project status report shown above is from the TPG ReportPack based on Power BI. There, you will also find many other report templates and examples.
Role of the Project Management Office (PMO)
Experience has shown: if many project managers have to hand in useful status reports by the due date, this only works with the support of the project management office (PMO).
Project managers tend to neglect the status report issue. In their day-to-day business, they regard it as tedious extra work.
The PMO on the other hand checks whether:
- There is an up-to-date project management status report for all projects
- All mandatory information has been entered
- The texts are plausible
- The values are plausible
- There is a reason for the variances, etc.
All the same, compiling the project management status reports is also a time-consuming affair for the PMO. It can only be successful if project managers and PMO work hand in hand. Therefore, always remind the parties involved how important status reports are for the success of a project.
Read more about The Challenges of Modern IT-supported PMO Reporting.
Project managers have to realize that project status reports are in their self-interest. Once this has happened, they will provide their input with more motivation and care. Two examples for the high value of the project status report are:
- Due to the project status reports, the PMO arranges certain issues for the project managers directly
- The steering committee can make well founded decisions earlier

Conclusion – Project Status Report
Due to its standardized structure, a good project status report provides you with an easy-to-read presentation of the project status in important sub-areas and a quick overview. This article has taught you:
- Why a standardized format is important for your project status report.
- How to combine overall traffic lights cleverly with traffic lights for details.
- What contents your project status report should include.
- How to use the Milestone Trend Analysis appropriately.
- What you need to consider for the target-actual comparison of work and cost.
- Why you should work with a risk matrix.
- How relevant decisions can be pushed.
- What kind of support the PMO can provide.
Our final tips
Get to know the individually adaptable “PPM Paradise” – the optimal environment for your enterprise-wide project, program, portfolio and resource management (PPM). Download the free eBook “The PPM Paradise” now (just click, no form).
And sign up for our bi-weekly blog newsletter with information on more practical articles, eBooks, etc. to improve your project management maturity level.
What has been your experience with project status reports? Do you feel we have missed an important point? We look forward to receiving your comments.
Subscribe to TPG BlogInfo: Never miss new practice-oriented tips & tricks
Every other week: Receive practical tips in TPG blog posts written by recognized experts in project, portfolio, and resource management.
* Required Fields | Data Protection
About the author: Johann Strasser, a certified engineer, has been a managing partner at TPG The Project Group since 2001. After many years as a development engineer in the automotive and energy sectors, Johann Strasser spent a decade as an independent trainer and consultant in the field of project management. During his tenure, he also served as project manager for software projects in the construction industry and provided scheduling and cost management support for large-scale construction projects. At TPG, he applies his expertise in product development and consulting services for international clients. His special focus is on PMO, project portfolios, hybrid project management, and resource management. For many years now, he has shared his knowledge through presentations, seminars, articles, and webinars.
You can read more about Johann Strasser on LinkedIn and XING.


")
4 Comments
I enjoy reading the PMO blogs..(1). Is there an example of an actual PSR?
Also a blog on how to describe the risks and issues in smart way? Tips to advise a PMS?
Thanks for your comment, Susan. Aside from the first and the last figure in this article, you can find an annotated example of a PSR (project status report) here. We also have an article on risk management on this blog: Risk Management in Project Management. For PMS (project management systems), our advice is to use Microsoft Project or Planisware. This article explains why MS Project might be the right option for you. Planisware is another powerful platform for enterprise project management. It is also available in the Enterprise version for larger companies and the Orchestra version suitable for small and medium-sized companies.
Very good content. Thank you for sharing you knowledge and experience.
Thanks, Francisco Fontana. You’re welcome.