


In this article, you will learn what a Milestone Trend Analysis (MTA) visualizes, how to read the chart and what benefits you can draw from it. In addition, we describe where to find a free MTA for Microsoft Project and how to install and use it step by step.
What you will learn about Milestone Trend Analysis in this article:
- Combination of history and forecast
- Explanation of the Milestone Trend Analysis chart
- How to use the Milestone Trend Analysis for MS Project
- Prerequisites for meaningful results from the MTA
- Conclusion: Milestone Trend Analysis for Microsoft Project

Looking for an introduction to Microsoft Project? Read MS Project Tutorial.
Combination of History and Forecast
The Milestone Trend Analysis is an easy-to-read combination of history and forecast for selected project milestones. It is used to graphically illustrate time-related discrepancies.
The MTA supports the project manager in controlling the project by:
- Providing simple reports with easy-to-read charts
- Revealing deadline bottlenecks in early phases of the project thanks to a clear trend overview
- Enabling a realistic forecast of the project progression
Explanation of the Milestone Trend Analysis Chart
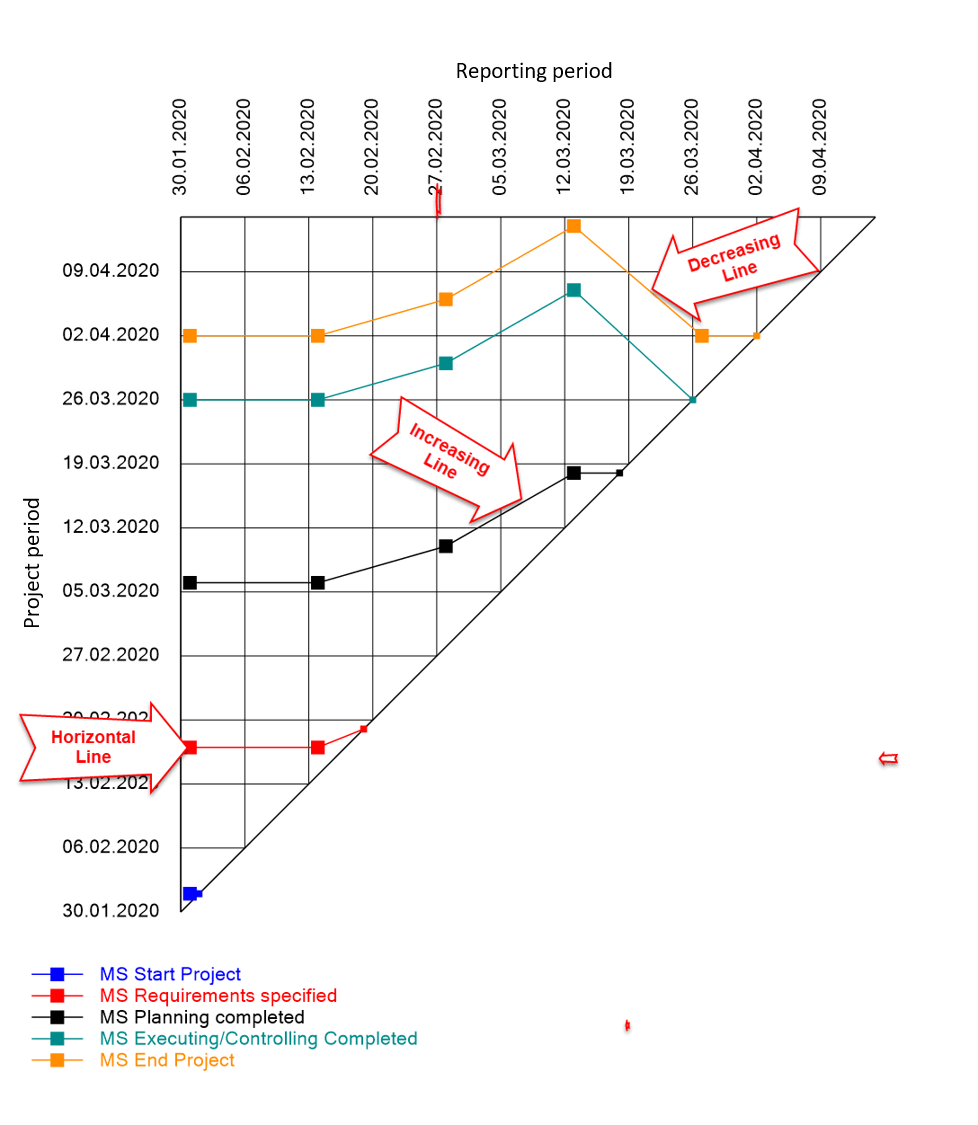
An MTA chart presents the project period on the vertical axis and the reporting period on the horizontal axis. At the beginning of the project, each milestone is displayed on the vertical axis. The earlier the deadline of a milestone, the lower it will be placed on the vertical axis.
If the project plan is regularly updated and the upcoming milestone status is saved as well, the milestone shifts in the course of the project will result in the familiar MTA curves. In this context, the lines indicate the following:
- A horizontal line means that the milestone date has not changed compared to the previous reporting period
- In the case of a decreasing line, a milestone has been brought forward and is now scheduled for earlier
- An increasing line indicates a shift to the future and represents a delay in schedule.
The MTA merely represents a history of past reporting periods. It is entirely at the discretion of the beholder to derive the forecast for the future development of the milestone trend.
Please be aware that the MTA merely represents a history of past reporting periods. It is entirely at the discretion of the beholder to derive the forecast for the future development of the milestone trend.
Yet, even the analysis of the past can be extremely helpful in identifying milestones at a glance that are shifted frequently. These shifts will impact the end of the project sooner or later, if you, as the project manager, do not take timely action to offset the schedule delay.
Thus, you can use the MTA as your perfect early-warning system for scheduling.

How to Use the Milestone Trend Analysis for MS Project
TPG The Project Group provides a Milestone Trend Analysis for MS Project (Standard / Professional Client) as a free add-in. You can download your free TPG MTA Client here.
Please, make sure you download the right bit version. Your MS Project bit version is what is relevant in this case (not the Windows version!): for example, select TPG MTA Client in 64 bit, if your MS Project is installed with 64 bit.
This is how you install the free TPG MTA Client:
- Download the file
- Start the installation
- Once you start your MS Project Client after the installation, you will see a new tab
- If this is not the case, please check whether you installed the right bit version corresponding to your MS Project system
And here is how easy it is to create the first snapshot of your project:
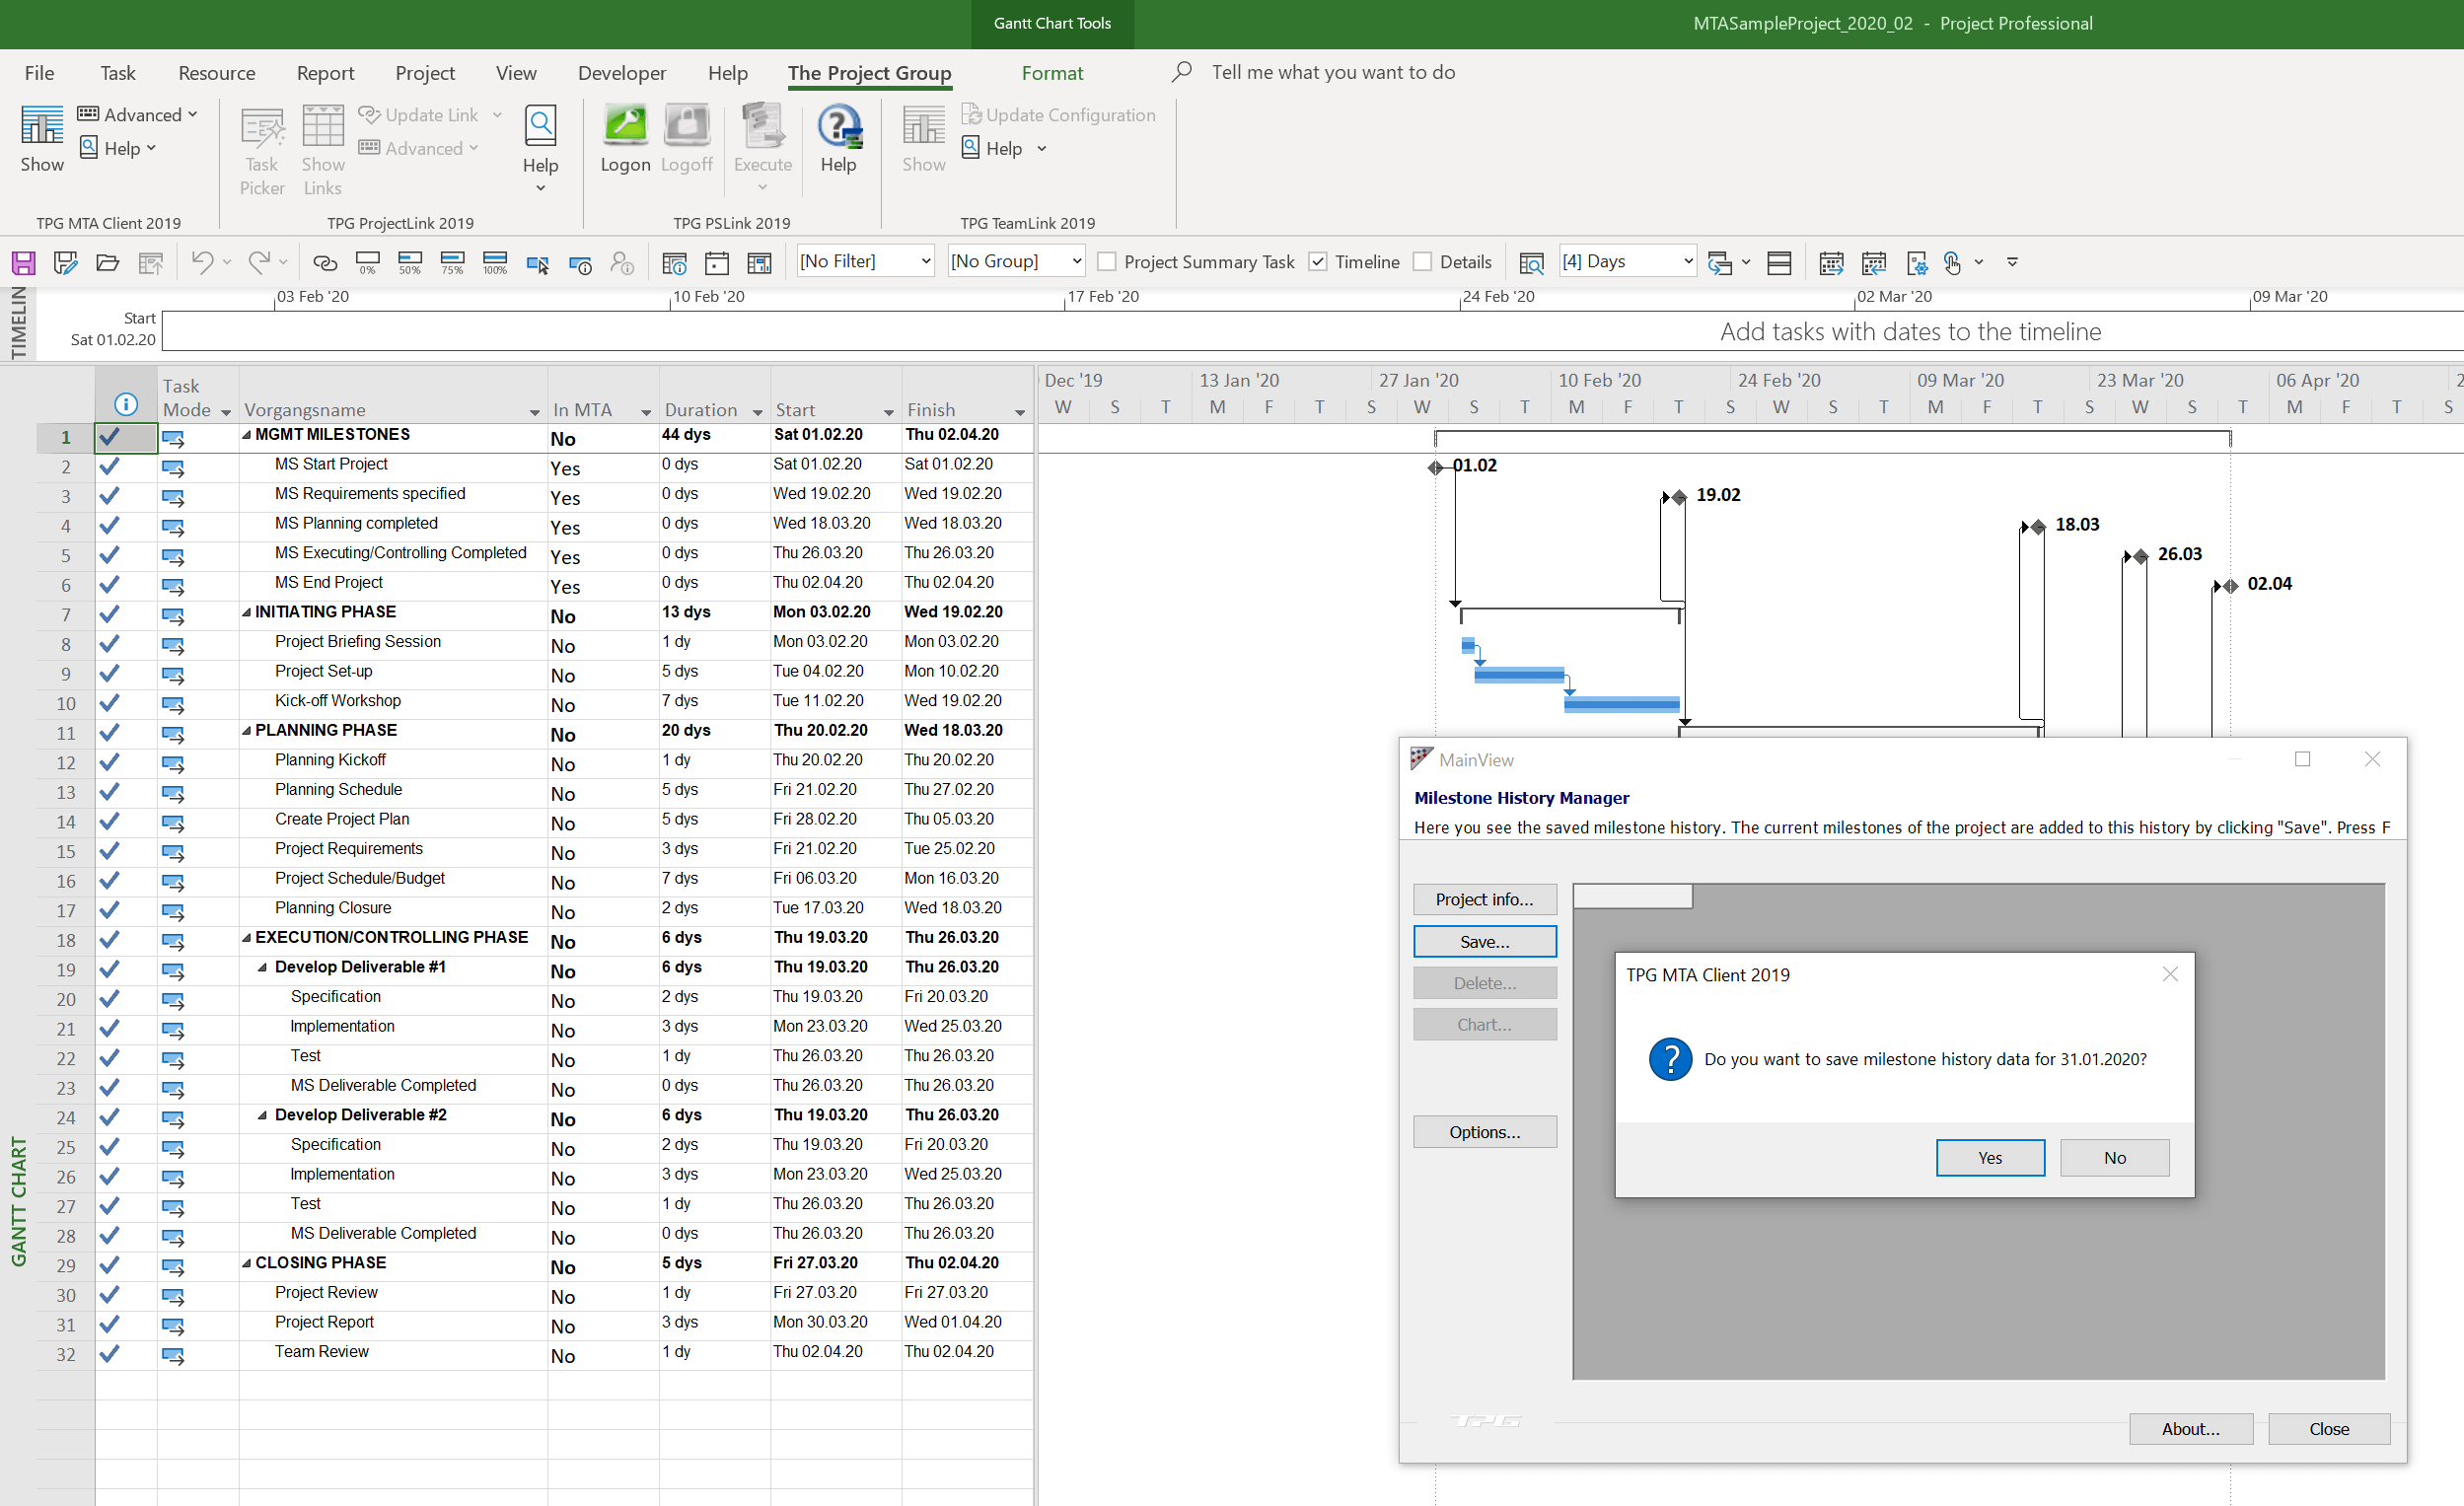
- Click Show in the ribbon The Project Group
- Click Save in the dialog window TPG MTA 2019
- Confirm the creation of the dataset of reports by clicking Yes
As a result, the dataset you saved will be displayed.
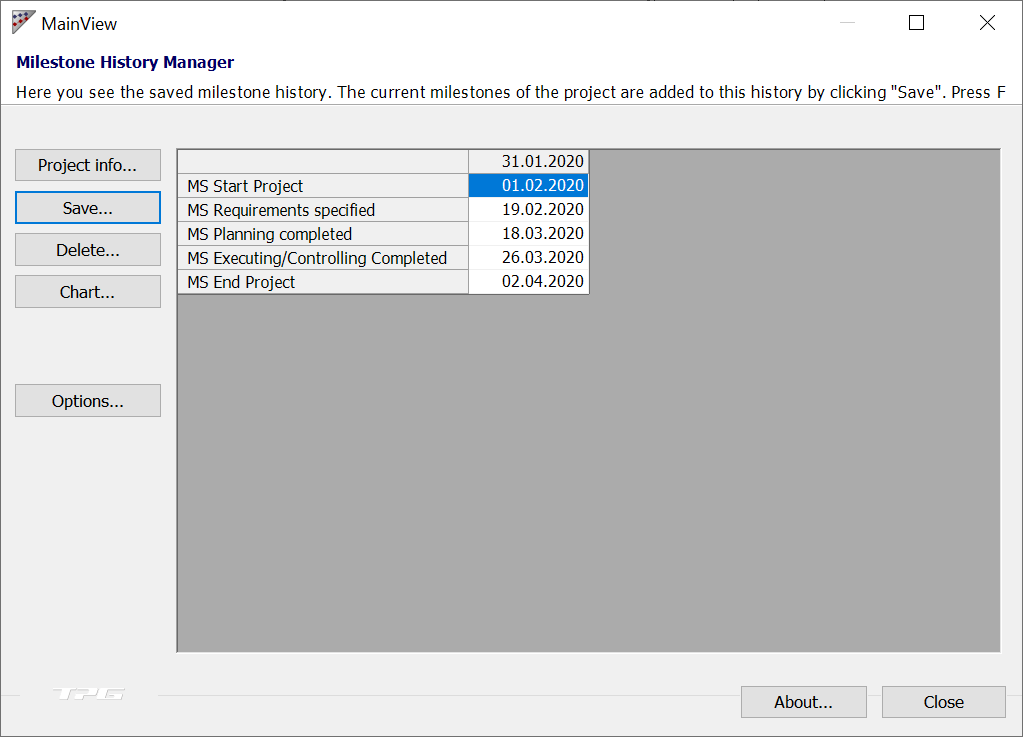
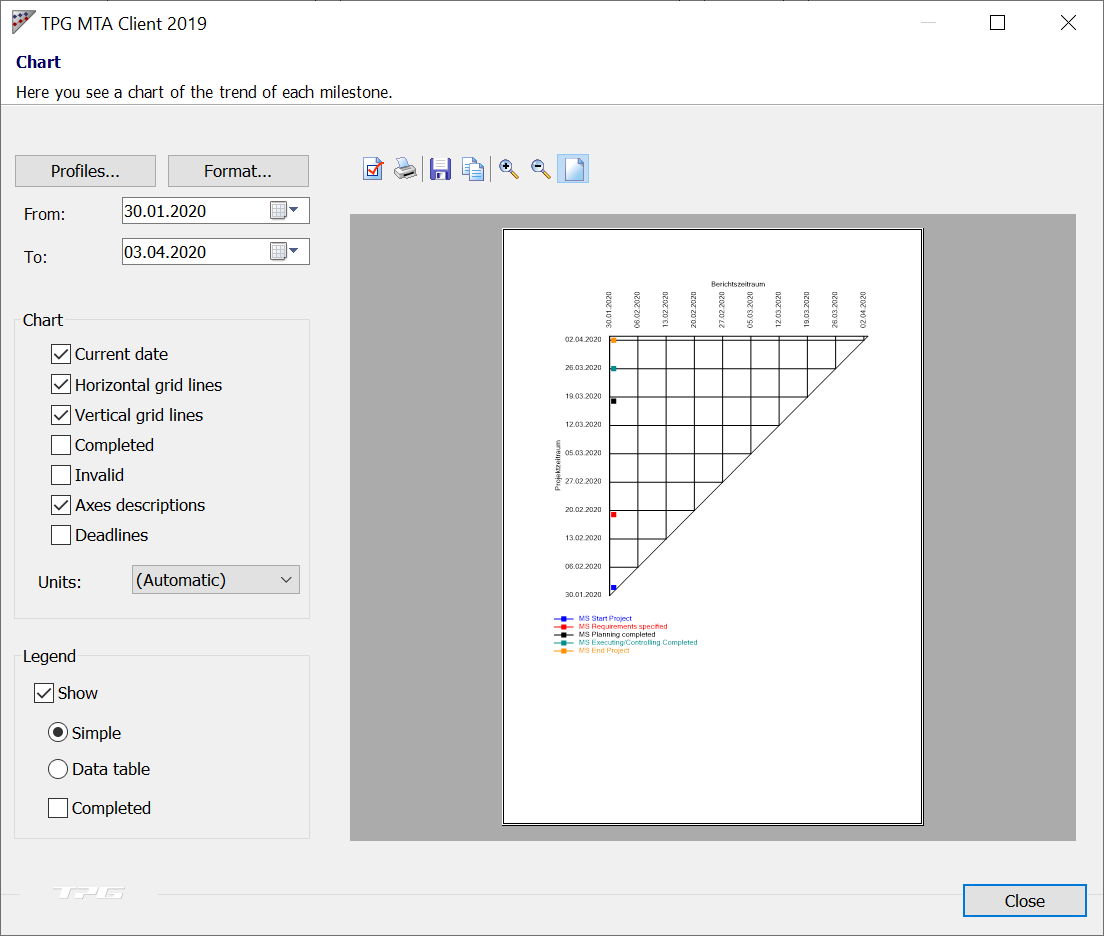
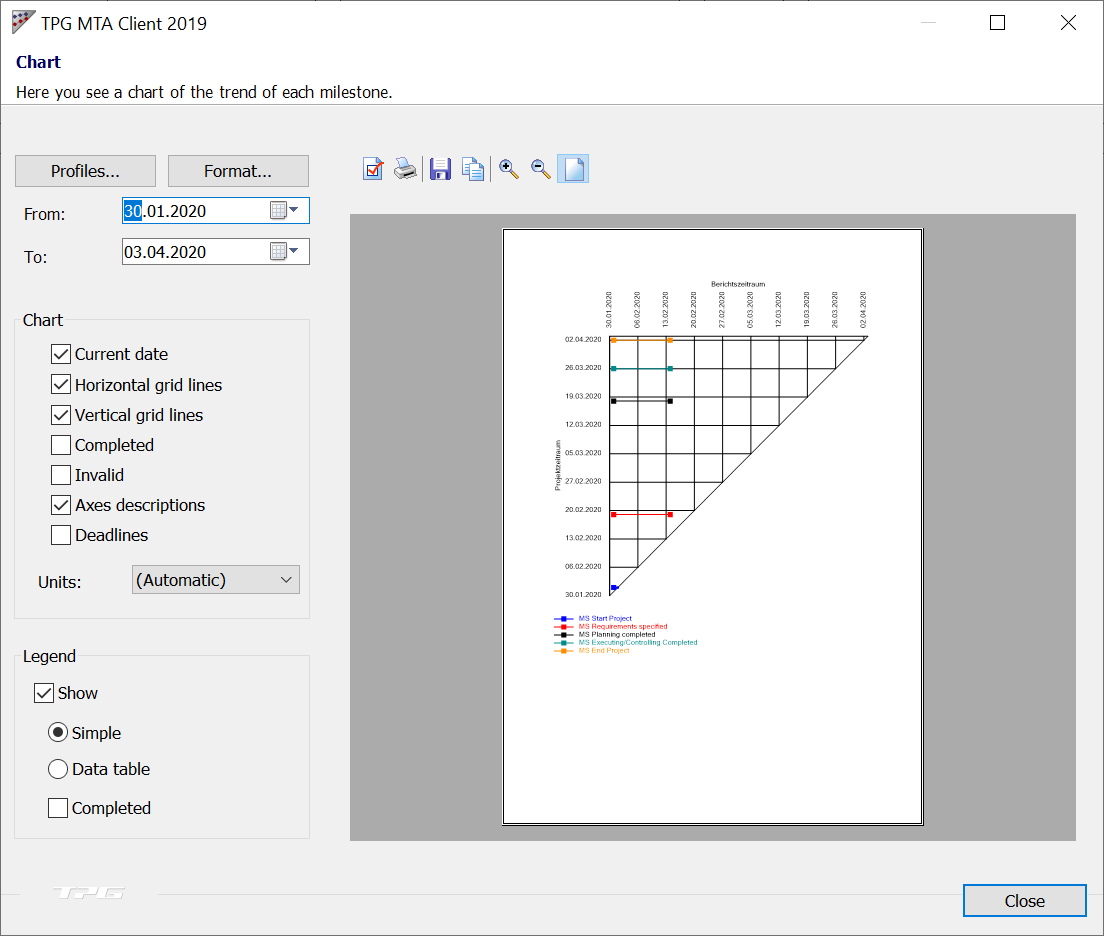
By clicking Chart, you can display the MTA chart. At the beginning of the project, each milestone is displayed on the vertical axis.
Below, we continue the example we began:
Two weeks later, the project plan is updated, and the current planning status is saved to the Milestone Trend Analysis tool again. During the reporting period, changes were made to the schedule, but no milestones were shifted. This can be determined from the horizontal lines for the last reporting period.
Two weeks later, the project plan is updated again, and the current planning status is saved to the Milestone Trend Analysis tool. During the reporting period, there have been changes to the schedule which have affected the milestones.
This can be determined from the increasing lines for the milestones MS Requirements specified, MS Planning completed, MS Executing / Controlling completed and MS End Project for the last reporting period. In addition, the milestones MS Requirements specified and MS Start Project have been completed; therefore, they are displayed on the 45-degree line.
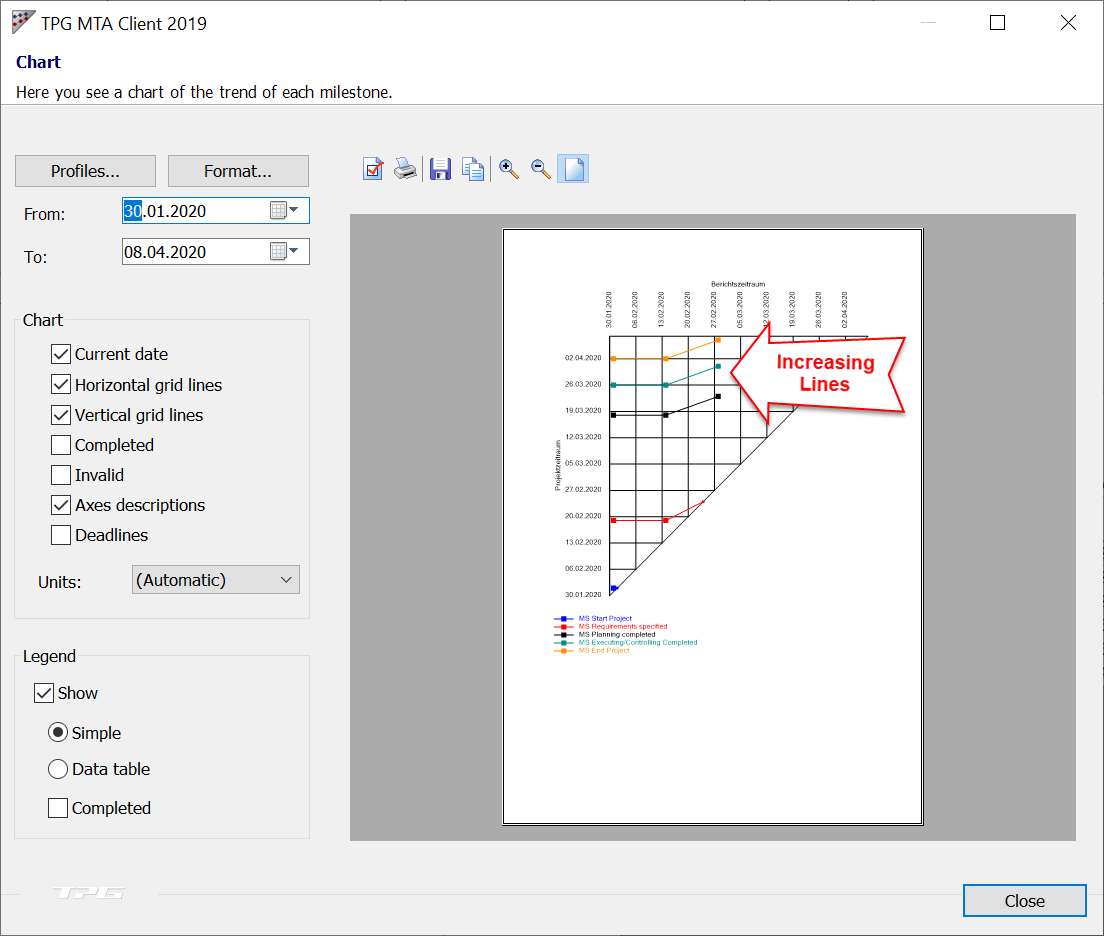
At the time the MTA data was saved, there was a shift of the milestones that were not yet completed. At this point in time, the end of the project was likewise postponed.
No later than now, measures should be taken to reduce the risk of further delays and avoid jeopardizing the project.
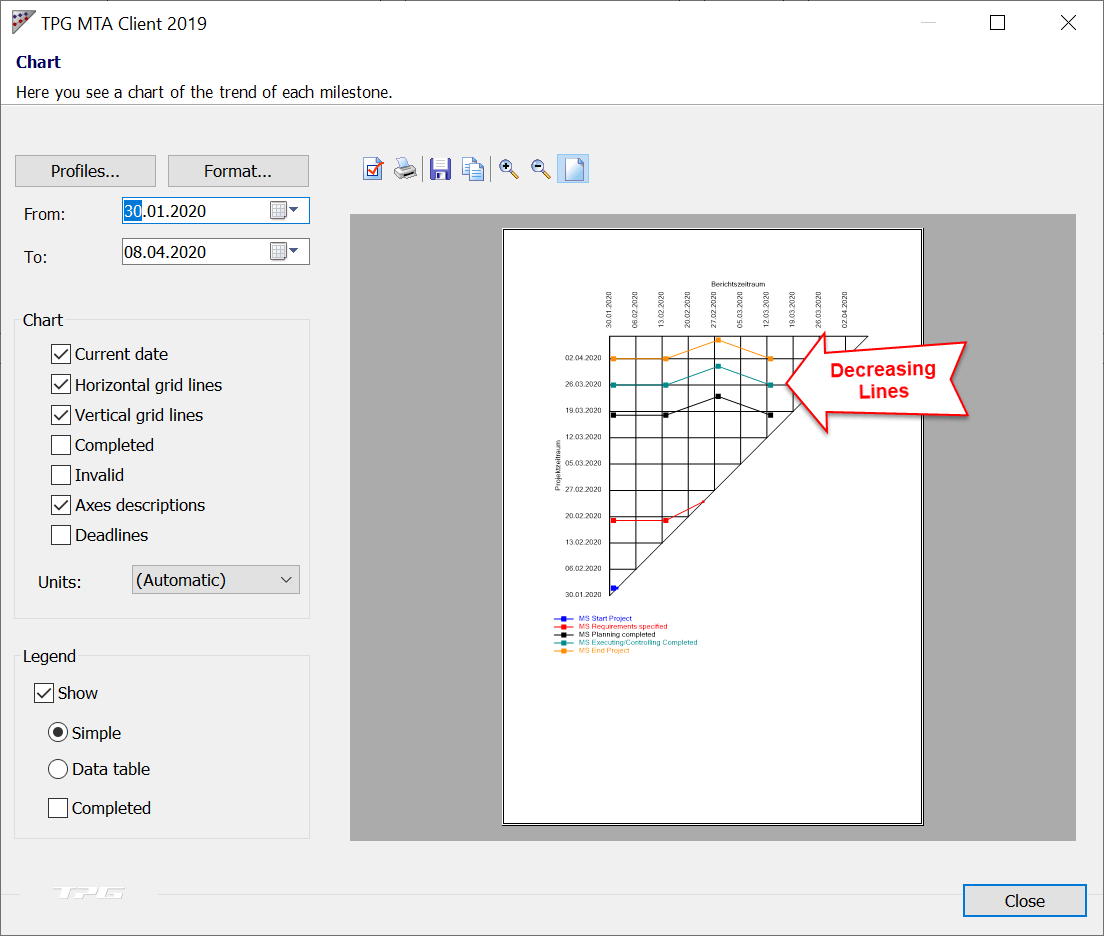
In the subsequent two weeks, an adjustment was made to the project before the MTA data was saved again. This can be determined from the decreasing lines:
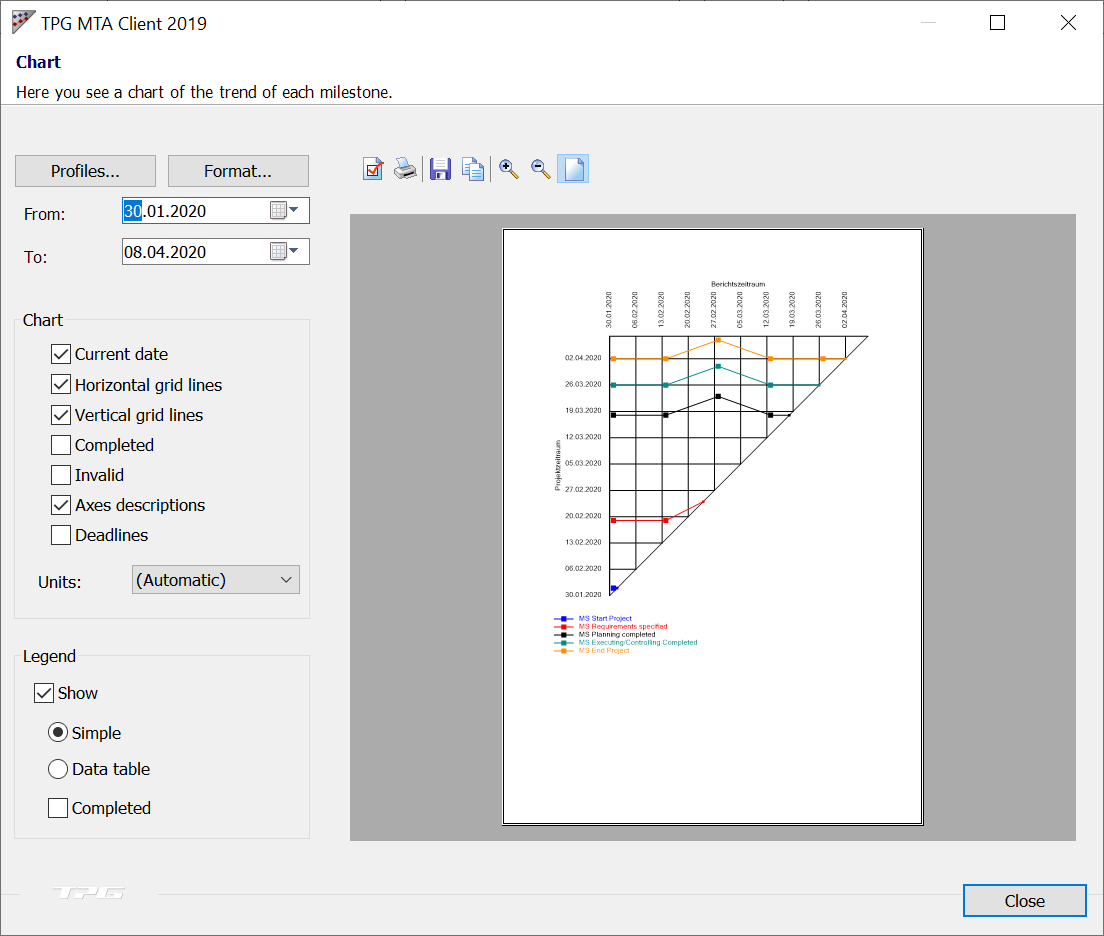
When the MTA data is saved from this point onwards, all connecting lines of the last reporting period lead into the 45-degree line. This makes it clear that all milestones have been completed.
By the end of project, the delays have been made up.
Prerequisites for Meaningful Results from the MTA
Please note that the MTA can only provide meaningful information, if the data is always up to date. This will only be the case if the schedule for all tasks and especially milestones is routinely updated before the creation of a snapshot.
In this way, the MTA can also contribute to a greater awareness of the schedule among project participants.
Working MS Project? Read article about Earned Value Analysis with MS Project.
A Milestone Trend Analysis can contribute to a greater awareness of the schedule among project participants.
Conclusion: Milestone Trend Analysis for Microsoft Project
In this article, you have learned how to use the Milestone Trend Analysis for project control, to identify potential delays in good time and be able to take countermeasures.
Using the free TPG MTA Client for Microsoft Project as an example, you have learned how to collect data for the MTA chart and how to interpret the chart.
Our final tips
Get to know the individually adaptable “PPM Paradise” – the optimal environment for your enterprise-wide project, program, portfolio and resource management. Download the eBook now (just click, no form).
And sign up for our bi-weekly blog newsletter to make sure you receive all our updates.
Are you using an MTA and what has been your experience with it? We look forward to receiving your comment below.
Subscribe to TPG BlogInfo: Never miss new practice-oriented tips & tricks
Every other week: Receive practical tips in TPG blog posts written by recognized experts in project, portfolio, and resource management.
* Required Fields | Data Protection
Author: Steffen Reister, Product Manager & Solution Architect at TPG The Project Group GmbH
Steffen Reister is a certified engineer for electrical engineering and author of handbooks on Microsoft Project. For over ten years, he has focused on the enterprise-wide use of Microsoft Project. He started working for The Project Group GmbH in Munich as a project manager and consultant in 2004. As a consultant and IT trainer, he optimized the method of process-oriented software implementation of Microsoft Project and Primavera P3e. His focus is not on the functionality of the software but on embedding the software into the functional processes of the respective company.
You can read more about Steffen Reister Linkedin.


")