


Earned Value Analysis (EVA) is a tool for controlling your project progress. Key performance indicators (KPI) delineate the current schedule and cost situation. Earned value management (EVM) and earned value project / performance management (EVPM) are synonymous terms for EVA. Using earned value analysis with Microsoft Project is a powerful method of project control.
In this article, you will learn how to determine earned value and the corresponding key performance indicators. Furthermore, you will find out how to portray these in Microsoft Project in order to get a calculation of the current status of your project including forecasts.
- Definition: What is Earned Value Analysis?
- General information about Earned Value Analysis
- Earned Value Analysis with Microsoft Project
- Conclusion
Definition: Earned Value Analysis
The Earned Value Analysis is a controlling method. Regardless of the size and complexity of the project, it provides clear key performance indicators on the progress of the project – with the aid of planned and actual values concerning cost, time and performance scope. In addition, the EVA permits forecasts regarding the project end and cost. The earned value is calculated from the sum of planned efforts for the performance scope achieved by a particular target date. This value is the most important calculation basis for the KPIs.
The results and benefits of the method are as follows:
- Valid statement regarding the current status of the project
- Forecast calculated to minimize the planning risk
- Comprehensible format as a basis for stakeholder decisions
Find out how to Keep Track of Project Progression with Project Status Reports.
General Information about Earned Value Analysis
When evaluating the current status of a project the following questions arise:
- What is the current effort?
- What has been delivered so far?
- What should have been the corresponding effort?
- When will the project end?
- What will be the overall effort?
Special Download: Advantages of MS Project Server / Project Online over MS Project Standard
Please click here to download the PDF and learn why you should prefer the server over the client version.
Simple Cost Variance
In order to determine the difference between planned and actual effort up until today, you need a baseline as a reference. This baseline needs to be set after the planning has been completed but before the first change and update with actual data.
Indispensable for EVA: set a baseline directly after planning has been completed.
The difference between the accumulated planned and actual values up until the current date adds up to a deficit or a surplus in the project. This reflects the current financial state of the project and is a very interesting figure for the payment plan. But it does not reflect how well the project is doing, as the stage of completion is not taken into consideration.
The simple cost variance is relevant for the payment plan but not for the actual state of the project.
In case of a surplus, you ask yourself:
- Have the costs really been lower than planned, or
- has the project not progressed as far as it should have?
In case of a deficit, the question arises whether:
- The effort has been higher so far or
- the project has progressed further than planned, i.e. more has been delivered.
And in both cases, it is relevant what this means for the following:
- Overall costs that are to be expected
- Project end date
Naturally, you will only be able to answer these questions reliably, if you know what content has actually been delivered so far.
Our tip: You are not currently planning the costs for work resources in your projects? You lack the real hourly rates of the resources or are not allowed to show them? If so, this might be interesting for you:
- You can assign all resources an hourly rate of EUR 1 without great effort and make EVA only relevant to the actual work. The real costs get left out.
- Important note: This will only work if you are not planning real costs anywhere else. In that case, the ratio and the calculation of the earning rate would be incorrect.
There are many users who can employ earned value analysis very well in this way, as their project costs are entirely controlled via the resource work anyway.
Earned Value
Earned value (EV) now establishes a relation between the stage of physical completion by the status date and the corresponding planned effort. This shows for the status date what effort was planned for the actual work performed.
The earned value is calculated from the stage of physical completion and the originally planned effort.
This is how it can determine the state of the project realistically and deduce a forecast for the future.
The illustration below shows the progression of planned costs and actual costs up to the status date as well as the stage of physical job completion from which the earned value is deduced.
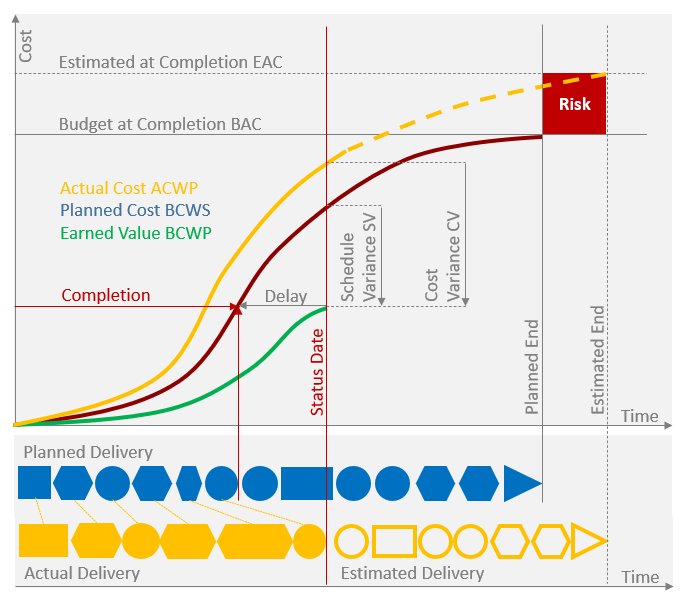
- The red curve shows the progression of costs in relation to the planned work (BCWS – Budgeted Cost of Work Scheduled) rising up to the level of the planned overall costs (BAC – Budget at Completion).
- The yellow line represents actual costs accumulated up to the current date (ACWP – Actual Cost of Work Performed).
- The ensuing broken yellow line illustrates the expected progression until the estimated end in terms of the expected cost (EAC – Estimated at Completion).
After the delivery items up to the current date (Actual Delivery) have been determined the result is transferred back to the original planning (Planned Delivery). This is where the real stage of physical job completion can be identified, which is significantly lagging behind expectations.
Thus, it is possible to read from the green plan curve what value the actual delivery has according to the plan. This is the earned value or also BCWP – Budgeted Cost of Work Performed.
Earned value therefore represents the costs which, according to the original planning, would have been necessary to reach the stage of physical completion attained on the status date.
Unlike actual costs, earned value represents the project’s stage of physical completion.
Accordingly, unlike actual costs, earned value (EV) is a strictly financial factor representing the project’s current stage of physical completion. The EV number on its own is not really informative and cannot be compared to other projects.
But EV is a perfect basis from which to deduce the really interesting key performance indicators for forecasts. It can be employed in order to check the plausibility of the remaining plan for the items which are yet to be delivered. This is how you can minimize the risk of further planning mistakes.
Interested in reporting? Learn about the 5 Most Important PPM Reports.
Real Cost Variance
Real Cost Variance (CV = BCWP – ACWP) reveals the difference between actual costs and earned value. It is used to describe the efficiency of projects. It can also be calculated in percent (CV% = [BCWP-ACWP]/BCWP) and thus is a figure that can be compared across projects.
Real cost variance can moreover be calculated as a Cost Performance Index (CPI = BCWP/ACWP):
- It equals 1, if everything is OK
- If it is below 1, the costs for the results obtained were too high
- If it is above 1, the work performed cost less than planned.
A CPI of 0.8 therefore reveals a cost increase whereas a CPI of 1.2 indicates a cost reduction.
Real Schedule Variance
Real Schedule Variance (SV = BCWP – BCWS) shows the difference between planned costs and earned value. It clarifies the financial gap between results obtained and results planned. If calculated in percent (SV% = [BCWP-BCWS]/BCWP), it is also a figure that can be compared across projects. The schedule variance will at all events impact time.
It can also be calculated using the Schedule Performance Index (SPI = BCWP/BCWS):
- It equals 1, if everything is OK
- If it is below 1, the costs for the results obtained are lagging behind schedule
- if it is above 1, the work performed is ahead of schedule.
An SPI of 0.8 reveals a delay whereas an SPI of 1.2 indicates a speed-up.

Forecast
You have created an updated schedule and calculated new overall costs after updating the project plan by entering actual values, stages of completion and a new remaining effort.
You can compare your new costs with the estimated value (EAC – Estimated at Completion). Depending on the resulting difference you should reconsider and possibly also revise your planning.
But before you do this you have to make assumptions about further developments to enable you to calculate the forecast.
- From now on according to plan: EAC = ACWP + (BAC – BCWP)
- Carry on as before: EAC = ACWP + (BAC – BCWP) / (CPI * SPI)
- No further schedule variance: EAC = ACWP + (BAC – BCWP) / CPI
(note: this is the formula used by Microsoft Project)

Subscribe to the TPG Blog Newsletter now and never miss another blog post.
The third option is the one calculated by Microsoft Project. The first two could be calculated using customized formulas.
The status update also includes the variance between the forecast and the planned overall cost (Variance at Completion VAC = BAC – EAC). This variance also needs to be calculated in percent, if it is to be compared to other projects (VAC% = [BAC – EAC]/BAC).
Suggested reading: PMO Reports for Project and Portfolio Management
Comparability of Projects
The hitherto mentioned indices and percentage values can be divided into stages and represented by traffic light indicators red / yellow / green. This allows users to quickly identify in a project overview which key performance indicators are not OK.
Traffic light indicators and division into stages make it easier to keep key performance indicators in view.
As a rule, actions are linked to the different colors that are meant to be taken in case the color changes:
- In the case of unfavorable values, the linked action usually is to inform, or escalate to, the steering board.
- Overly good values might prompt the revision of the plan or rather disclosure or removal of scheduled buffers.
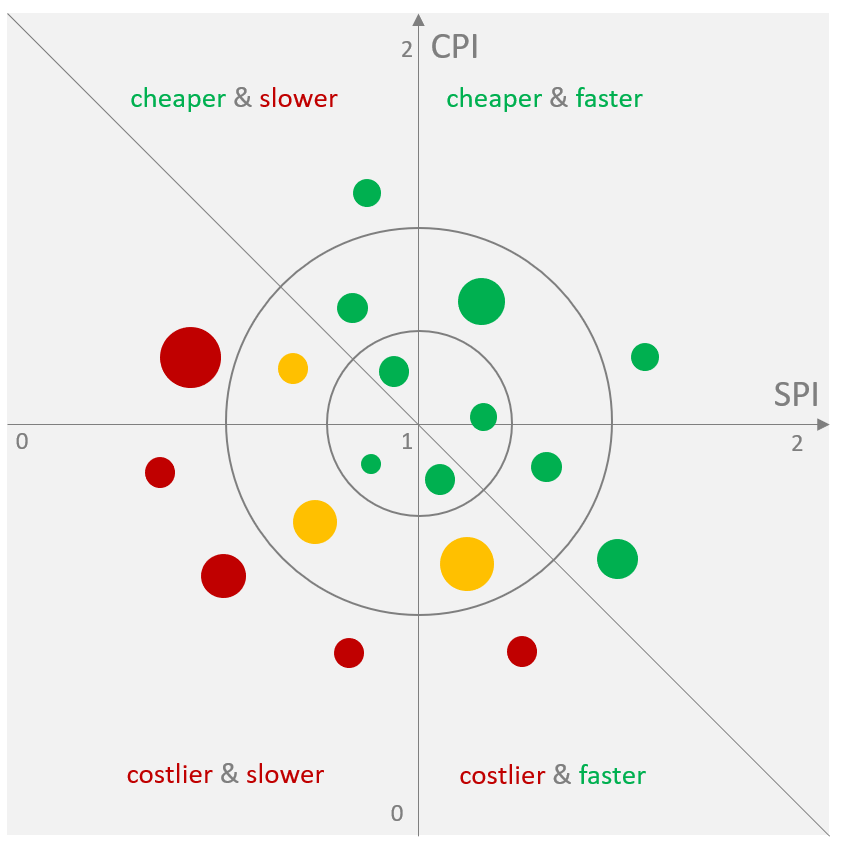
It can happen that a CPI > 1 coincides with an SPI < 1 or vice versa. The meaning can also be graphically illustrated. The diameter of the individual projects can represent the planned costs in this case. This also allows for the appraisal of the absolute degree of variance.
How Earned Value Analysis with Microsoft Project Works
To begin with, you should know: Microsoft Project calculates earned value for all tasks that have:
- Planned costs (Baseline Cost in MS Project),
- Their beginning before the status date,
- A stage of completion that is greater than zero.
To recap: This will only work if you save a baseline once planning has been completed and before the first update.
Here is how you do it:
Under Options / Advanced / Earned Value options for this project, you can select one of the eleven baselines available for earned value calculation.
In the same place, you can also select which field you want to use for the completion in the EVA:
- Field % Complete
- Field Physical % Complete
Watch out: For better comprehension we will call the field % Physical Complete in this article. However, in Microsoft Project the field name actually is Physical % Complete.
The update of the field % Complete is usually linked to the update of resource work, i.e. to the field % Work Complete. This does not necessarily permit a statement regarding the stage of physical job completion.
In order to remove this link, you can switch off the corresponding property, Updating task status updates resource status, under File / Options / Schedule for this project.
Remove the link between resource work and the field % Complete in order to obtain a statement regarding the stage of physical job completion.
But watch out: even then, you might not obtain appropriate results, as % Complete is inextricably linked to the current and remaining duration. Which again might not correspond to the actual work performed.
Our tip: As a general rule, it is clearer to use the field % Physical Complete, as it is independent of all other values. This allows you to enter the actual stage of completion without affecting the update of duration, work or cost.
Updating the Project
First, it is advisable to set the status date in the project information and possibly have it also displayed as a vertical line in the Gantt chart via Format / Gridlines.
The correct update of all tasks is the second prerequisite for a correct calculation of the earned value analysis. To achieve this, you have to enter the current hours and costs as well as the remaining work and duration from which % Work Complete or % Complete are calculated.
Struggling to distinguish MS Project versions and their differences? Read article.
As a result, the progress lines of all running tasks have to reach up to the status date. The inaccuracy in calculating the earned value using % Complete is due to the circumstance that the use of time does not necessarily correspond to the physical job completion.
If you set the calculation method of the earned value to % Physical Complete, this field needs to be edited for every task started or completed.
In doing this, you should define a rule specifying exactly how these values are to be entered.
- Single-figure percentage entries usually do not need to be entered this accurately and are likely to be scrutinized.
- In this case, the inaccuracy furthermore depends on the number of running tasks.
- Tasks which have not been started or have been completed are to be simply entered as 0% or 100%.
Read our other MS Project Tip telling you How to Use Resource Engagements in Project 2016!
Calculation in Microsoft Project
The earned value calculation is basically the same for both methods.
The planned costs or baseline cost (field Base. Cost) are accumulated according to % Complete or % Physical Complete alongside the planned duration day by day.
Example: If a task has EUR 800 of baseline cost per day over 4 days and 50% completion, the baseline cost will be added up to 50% of the planned duration. In this case, it adds up to 2 days with EUR 800 each, i.e. EUR 1600.
The forecast in Microsoft Project is calculated according to the third case mentioned above:
EAC = ACWP + (BAC – BCWP) / CPI
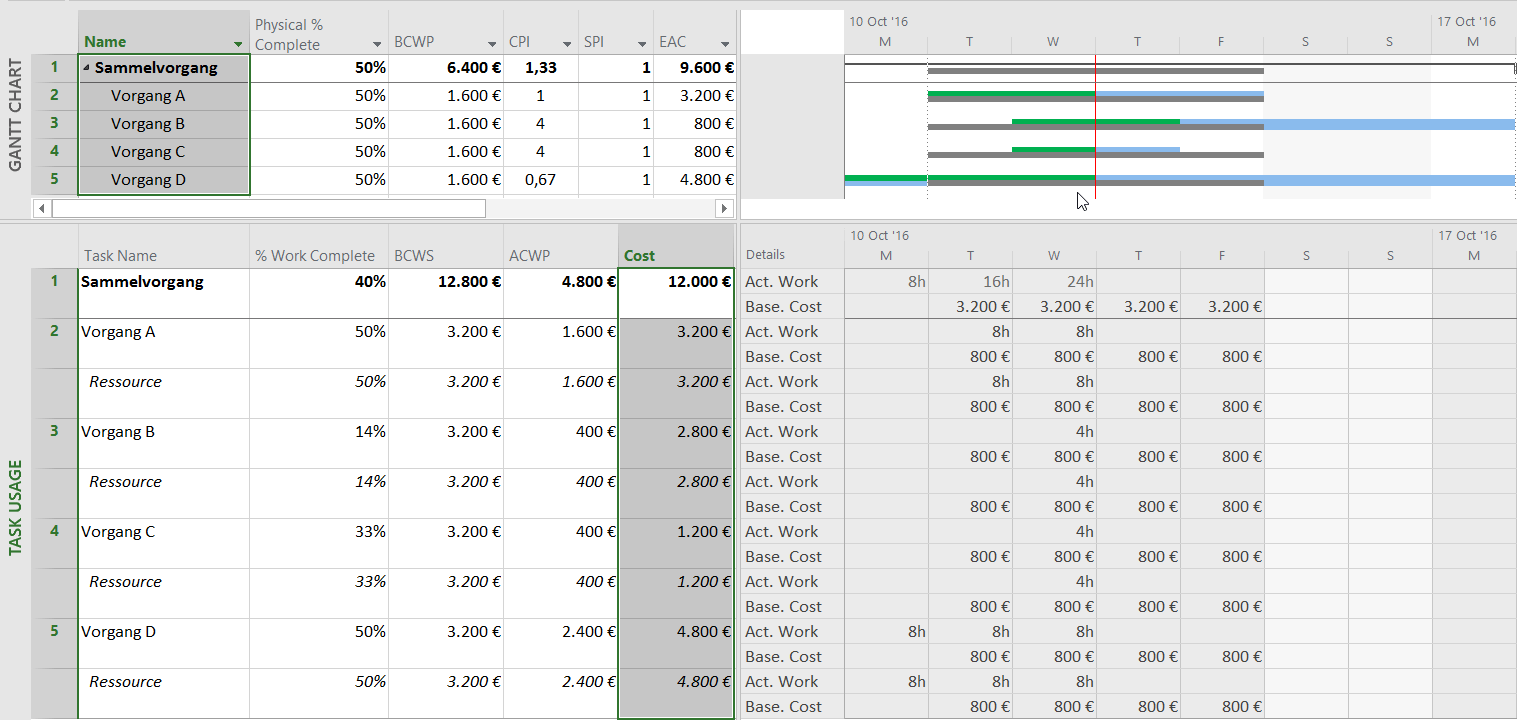
In order to follow the calculation on the screen, select a Gantt chart in the top view and View / Task Usage for the bottom view and display the columns as shown in the figure further below.
Sticking with our example: You have four tasks with a duration of 4 days each whose baseline begins on Tuesday and costs EUR 800 per day – as you are using one resource each with an hourly rate of EUR 100 for 8 hours a day. Therefore, the planned overall costs of each task are EUR 3,200.
The status date is set to Wednesday evening and the tasks were updated in different ways in order to be able to explain the logic of the calculation using a real situation.
Calculation Using % Complete
All tasks have been set to the earned value method % Complete.

Task A (“Vorgang A”) is implemented according to plan and reaches a degree of completion of 50% by the set status date.
- This means the earned value is EUR 1,600 at 50% of the planned and actual duration.
- CPI and SPI are both 1, as the actual costs match the baseline cost (Base. Cost).
- The forecast matches both the baseline and the current planning at EUR 3,200.
Task B (“Vorgang B”) starts a day late and with only 4 hours – rather than the 8 hours planned. Still, 50% completion is reported for this task. This causes the progress line to jut out past the status date and the carry-over to be ignored in the calculation.
- Only 25% of the planned duration are accumulated resulting in only one day at EUR 800.
- The CPI equals 2, as this was achieved with a cost of only EUR 400.
- The SPI is calculated as 0.5, as only half the planned performance of EUR 1,600 has been delivered.
- The forecast is EUR 1,600, in accordance with the above formula. Accordingly, the real remaining work will be performed at half price, i.e. 400+(3,200-800)/2= EUR 1,600.
- The costs of the current planning are now EUR 2,800 resulting from the 4 hours performed and the 8 hours on the remaining 3 days, which have not been rescheduled.
Task C (“Vorgang C”) shows the correctly updated Task B. If 50% completion were achieved in 4 hours on only one day, the duration needs to be reduced from 4 to 2 days. That is why the progress line only reaches exactly up to the status date.
- This results in an earned value of EUR 1,600.
- The CPI arrives at a value of 4, as in 4 out of 16 hours only a quarter of the costs was accumulated.
- The SPI amounts to 1, as still only the planned work representing EUR 1,600 was performed by the status date.
- The forecast is EUR 800, as the second day could also be achieved with the performance of the first day.
- The costs of the current planning are now EUR 1,200 resulting from the 4 hours performed on the first day and the remaining 8 hours of the second day, which have not been rescheduled.
Task D (“Vorgang D”) begins a day earlier than planned, but with 8 hours per day only 50% completion are achieved.
- This results in an earned value of EUR 1,600.
- The CPI only arrives at 0.67 due to the third of additional effort.
- The SPI is 1 due to the expected EUR 1,600.
- The forecast is EUR 4,800, as a third of additional effort is to be expected.
- The current baseline cost also amounts to EUR 4,800, as the duration has already been extended to 6 days with 8 hours each.
In the Summary Task (“Sammelvorgang”), the planned value and the earned value are calculated from the sum of the subtasks whereas % Complete is calculated from the actual position of the current start and the current duration. The values for CPI, SPI and EAC are calculated anew in the summary task, so that EAC is not the sum of the subtasks here.
If you want to calculate this yourself, take care not to use the displayed value of the CPI, as great rounding differences can result with only two decimal places. Calculate with the values BCWP/ACWP instead. In this case, that would be 4,800+(12,800-5,600)/(5,600/4,800)=10,971.4.
The sum of the current planning amounts to EUR 12,000 compared to the EUR 10,972 from the total in the Summary Task and the EUR 10,400, which is the sum of the EACs of all tasks. It could therefore make sense to revise the effort planning for the tasks that have so far gone well a little downward so that the delay of one day can be remedied – possibly by a reallocation of resources.
Calculation Using % Physical Complete
Using the same data after switching to % Physical Complete and entering “50% Physical Complete” for all tasks, you will get almost the same result as with the previous method.
Task B (“Vorgang B”) now has different results for earned value, indices and forecast, as the carry-over of 50% past the status date is not truncated. In this case, irrespective of the position, 50% is half the planned performance, i.e. EUR 1,600. This is how the SPI arrives at 1 and the CPI at 4 as in Task C – regardless of further planning for the remainder of these tasks.
In the Summary Task (“Sammelvorgang”), you can now find a forecast corresponding to the sum of the subtasks.
The earned value itself can only be interpreted if you know the budget of the project. What is more, it cannot be compared across several projects. It therefore makes more sense to pass on the indices and percentage variance of the forecast as project status information to others.
These values are easily classifiable and independent of the projects’ timeframes and budgets.
No matter how long the project takes – a CPI of 0.5 will make your name just as prominent in the company as a CPI of 1.5.
Conclusion – Earned Value Analysis with Microsoft Project
In this article, you have learned that Earned Value Analysis with Microsoft Project is a powerful tool for tracking the progress of your project. You have learned about the concept and how to use it.
To calculate earned value in Microsoft Project, one option is to use the field % Complete. With this approach, you will be able to determine whether the time you spent on a project up to the status date corresponds to the time scheduled.
The second option is to use the field Physical % Complete for EVA with Microsoft Project. This is the method we recommend, as it considers whether in the time spent on a project you actually reached the planned stage of physical job completion (e.g. the planned project milestone).
Tip: The skill of understanding earned value and also the indices is not very common. Make sure you always check whether the recipient of the data can deduce the relevant information from them. It is always better to pass on the illustrations shown above than mere figures.
In your position as a project manager, we recommend you use earned value analysis in order to check the plausibility of your own planning – it will minimize your planning risk.
Do you use Earned Value Analysis with Microsoft Project? What has been your experience with this approach? Please leave a comment below.
About the author: Johann Strasser, a certified engineer, has been a managing partner at TPG The Project Group since 2001. After many years as a development engineer in the automotive and energy sectors, Johann Strasser spent a decade as an independent trainer and consultant in the field of project management. During his tenure, he also served as project manager for software projects in the construction industry and provided scheduling and cost management support for large-scale construction projects. At TPG, he applies his expertise in product development and consulting services for international clients. His special focus is on PMO, project portfolios, hybrid project management, and resource management. For many years now, he has shared his knowledge through presentations, seminars, articles, and webinars.
You can read more about Johann Strasser on LinkedIn and XING.


")
8 Comments
Our organization uses MS Project Server 2013 along with timesheets. We’ve pretty much found that due to problems in the way Project loads timesheet data that EV is pretty much unusable. Here’s an example to illustrate why.
Task A finishes Monday at 4:50PM. Task B starts on Monday at 4:51PM and it has 10 minutes of 24 hours of work planned for Monday. When the real work occurs, the resource starts Task B earlier than planned and completes 8 hours of Task B work on Monday. Unfortunately, Project takes the 8 hours of work applied on Monday and actually loads it as having occurred in the last 10 minutes of Monday. Yes, all 8 hours are loaded into the 10 minute Monday duration. As a result, EV calculations thinks Task B has only completed 10 minutes, not 8 hours and the EV calculation is way off.
We’re working with Microsoft to see if this can be fixed, but based on feedback, it appears it won’t be. So be aware that the EV calculations may not be very accurate.
Where did you get that the used formula by project is: EAC = ACWP + (BAC – BCWP) / CPI?
Which version is this? I have always known project to calculate EAC = BAC/CPI
Mostafa AbdelRazik, you can find this formula in the Microsoft online help: https://support.office.com/en-us/article/eac-task-field-c239ab92-01e6-4186-bc0a-a745eaaf23a7
This calculation makes sense, as it provides a realistic extrapolation based on the results already obtained.
They are mathematically the same.
The first (longer) formula just breaks down EAC into ACWP + Estimate to Complete.
In my MS project 2016 EVM method is visible when work resources are assigned.Cost of cost & material resources are not getting counted in any EVM calculation.Is it default or should i have to change any setting????
Dear Rajeev,
please excuse the delayed answer to your comment. The reason for the delay was that a few of my colleagues and I investigated the issue you described in your comment. We are also using MS Project 2016 (16.0.5017.100).
The first part of the answer is, no, you do not have to change anything in the MS Project settings to use EVM. The only decision you have to make is, to select which progress method should be used for EVM: % Complete or Physical % Complete.
The second part of the answer concerns the cost and material resources in EVM. When using EVM the result of our investigation was that cost resources and material resource are getting counted in EVM. The only issue we had was that the PV of a cost resource was not computed, the value was always 0€. Thus, the consolidation of the PV from tasks up to the project summary task, was also incorrectly calculated. The cost of the assigned cost resource was not added. The table below shows EVM for a simple project. Basic data are:
• Task 1: Work resource assigned
• Task 2: Cost resource assigned
• Task 3: 3 units of a material resource assigned (1 unit of material = 333€)
• Status date of the project is set to the middle of the project duration
• Thus, the expected progress is 50% if all things went as planned
• Progress of all tasks is 40%
• Actual cost of task 1 is 4000€ (8000€*0.4=3200€)
• Actual cost of Task 2 is 800€
• Actual cost of Task 3 is 399€ (999€*0.4=399€)
• I did not update the project! This is because I want to avoid the impact of updating on Task 1 where the work resource has been assigned; for manual calculation using 40% is easier than 36%
• Baseline cost of the project is 10233€
• With 50%, the PV of the project is 5116€
• In MS Project, the PV is 4499€. The difference is 617€.
• This is exactly the PV of the cost resource assigned to Task 2 (1234€*0.5=617€)
(I split the table in three, as it is too wide to display in one piece.)
• Nevertheless, all other values are computed correctly!
• EV of the project is 10233€*0,4=4093
• EV of all tasks is also correct
• And on Task 2 where the cost resource is assigned:
o EV=999€*0,4= 399€, correct
o CV=493€-800€= -306, correct
o SV=123€ without showing the PV in MS Project!
o SV = EV-PV -> PV=EV-SV -> (493€ – (-123€))= 616€
• MS Project calculates EVM correctly, but the PV of cost resources is not shown in the sufficient column.
Best regards
Martin
Perhaps the biggest benefit to implementing EVM is that it is a single system that can track the project in terms of work, time and money; Project managers do not have to learn multiple systems.
The EVM is simple and shows the status of the project promptly.